Guide 01
Find the Wi-Fi worth trying first
Narrow your Wi-Fi choices by comparing up to five networks on one chart. See which stayed visible during your recorded monitoring and how much evidence supports your shortlist.
Where you will workStatistics comparison chart and evidence cards
Allow5–10 minutes after recording useful history
Watch the key steps
A 40-second narrated overview. Follow the full instructions below when you try it.
Read the video transcript
Choose one period. Open Statistics, choose Wi-Fi, and select one period for every candidate. Check monitoring coverage before comparing presence.
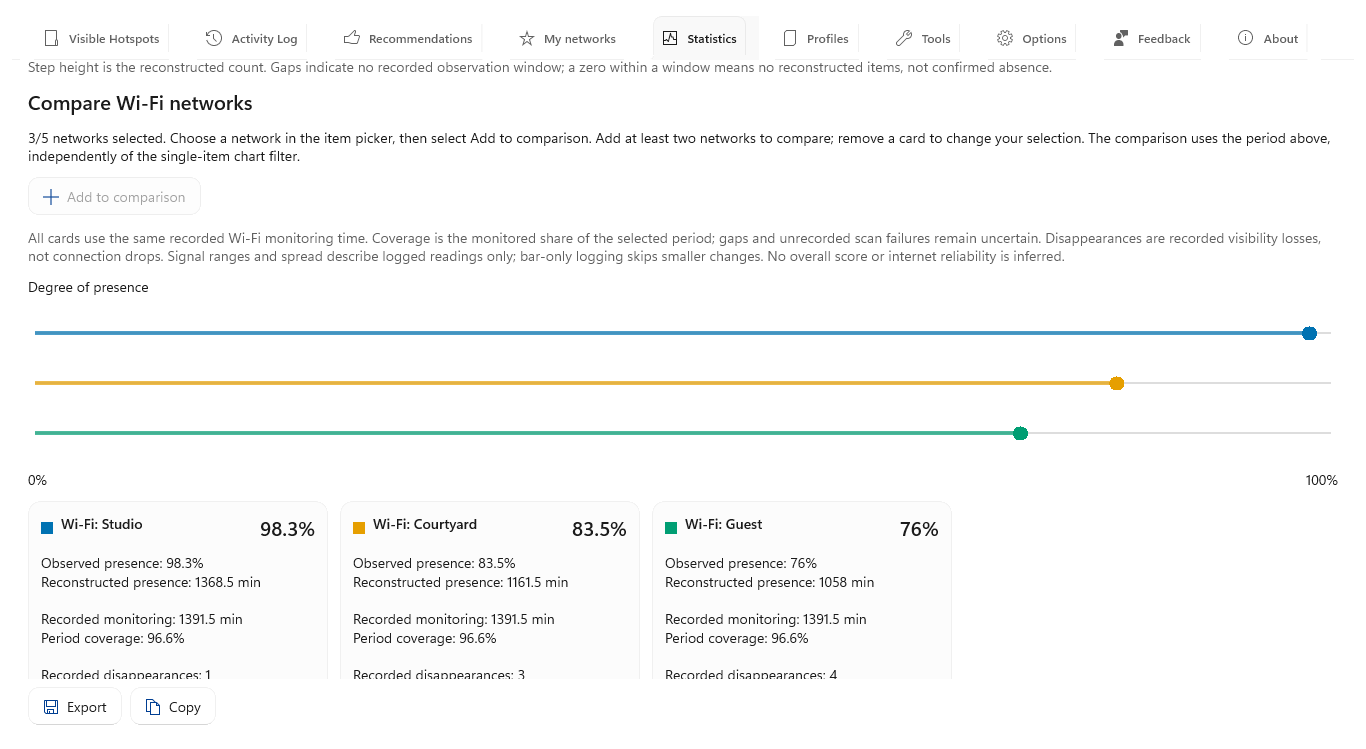
Build your shortlist. Select a network and choose Add to comparison. Repeat for two to five networks. Match each colored dot to its evidence card.
Inspect the evidence. Compare presence, coverage, disappearances and longest observed intervals. Select a candidate and open Presence to inspect its gaps.
Keep the comparison. Export the prepared comparison to a workbook. Recorded presence describes nearby visibility, not connection uptime or guaranteed internet access.
Open the app view at full size to inspect its controls.
Before you start
Give your result a useful basis
- Record the candidate networks from the place where you intend to use Wi-Fi.
- Keep persistent Activity Log history for the period you want to compare.
Choose one period
Make your comparison fair: open Statistics, choose Wi-Fi and use one recent period or set of custom local dates for every candidate. The Overview coverage ring separates recorded monitoring from unknown time, so you can see how much of your day the comparison covers.
Build the comparison
Keep your shortlist together while you explore. Select a network and choose Add to comparison, then repeat for two to five networks. Choosing the next item does not replace existing cards; the comparison keeps the period above independently of the single-item chart filter.
Match colors and values
See differences at a glance by matching each colored dot to its card on the shared 0–100% presence chart. Read the exact percentage or Unknown label as well as the graphic, so color alone never decides your choice.
Check what supports the percentage
Check whether a promising result covers the hours you need. Read each card’s monitoring coverage, disappearances, longest observed interval and signal range with bars. A high percentage based on a short observation may tell you little about a full working day.
Inspect a candidate's gaps
Investigate a candidate before relying on it. Select it in the item picker and open Presence to inspect the timeline and interval durations. Monitoring gaps stay unknown; interrupted and date-clipped intervals are excluded from complete-duration summaries.
Refine and keep the shortlist
Keep the evidence for your next visit: export the prepared comparison to a workbook. Remove cards to try other candidates, review calculated ratings in Recommendations, and check your actual connection sessions in My networks before choosing.
Check what you gained
You can now check that
- Two to five networks appear together on the shared 0–100% presence chart.
- Your comparison uses one period and accounts for monitoring coverage, disappearances and longest observed intervals.
Updated by Hotspot Observer · 21 October 2026