Guide 02
Find Wi-Fi patterns around the hours you need
Check whether nearby networks tend to be visible when you work or visit. Use the weekly heatmap to spot recurring patterns, then check the monitoring behind each result.
Where you will workStatistics → Time patterns and Exact weekday and hour values
Allow5–10 minutes after monitoring across several days
Watch the key steps
A 43-second narrated overview. Follow the full instructions below when you try it.
Read the video transcript
Set your scope. Open Statistics. Choose Wi-Fi or Bluetooth and a period covering several days. Select one item when you need its individual pattern.
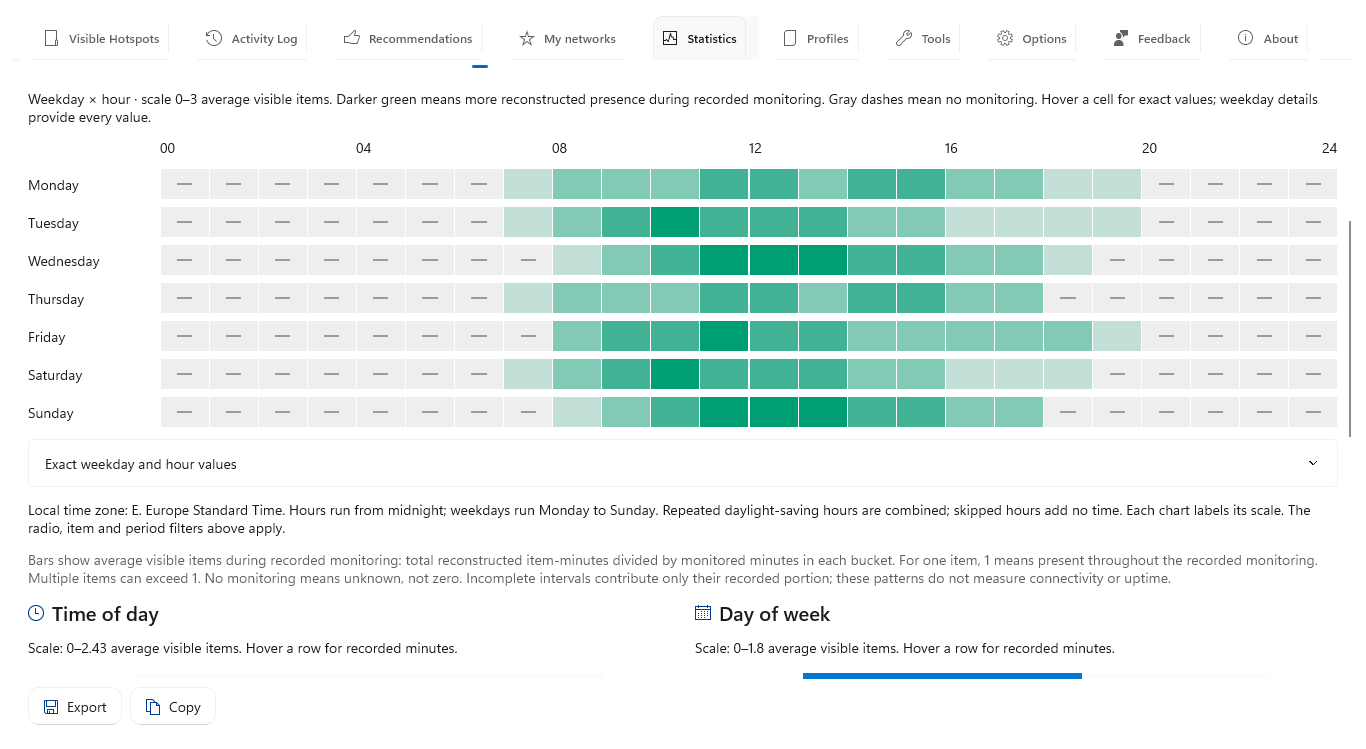
Read the weekly heatmap. Open Time patterns. Darker green means more average visible items. Gray dashes mean no monitoring, not absence.
Check exact values. Hover a cell or expand Exact weekday and hour values. Compare recorded minutes alongside averages before treating a pattern as a routine.
Save the pattern. Export with Time patterns selected. The workbook retains the weekly view and all 168 time slots. These are local-time observations, not predictions.
Open the app view at full size to inspect its controls.
Before you start
Give your result a useful basis
- Run the app during the days and hours you want to investigate; it cannot reconstruct unobserved time.
- Set retention long enough to include the weeks you intend to compare.
Set the scope
Focus on the times that matter to you. In Statistics, choose Wi-Fi or Bluetooth and a period covering those days. Keep the overview selection for nearby-item patterns, or select one network or device to follow its own presence.
Open Time patterns
Look for recurring hours in Time patterns. The heatmap covers seven days and 24 local hours: darker green means more average visible items during monitoring, while gray dashes mean no monitoring. A darker slot is not a Wi-Fi quality rating.
Check the exact evidence
Check how much evidence supports a pattern before planning around it. Hover a cell or expand Exact weekday and hour values to read its average and recorded minutes; similar colors can be based on very different amounts of monitoring.
Compare the summaries
Use the hourly and weekday bars to find broad patterns quickly. Then return to the heatmap to see whether a high weekday average comes from a few hours or a pattern that lasts through your day.
Check a suspected disappearance
If a network seems to vanish at a regular time, select it and inspect Presence over those dates. Activity Log gives you individual appearance and disappearance events. A blank monitoring interval cannot tell you whether it was absent.
Save the weekly view
Save a pattern you want to revisit by exporting with Time patterns selected. Your workbook keeps the weekly visual and exact values for all 168 slots alongside their recorded monitoring time.
Check what you gained
You can now check that
- You can identify a recurring weekday/hour pattern and read its exact average and recorded minutes.
- You can distinguish a measured low value from a gray slot with no monitoring.
Updated by Hotspot Observer · 21 October 2026