Guide 09
Find clues when your connection feels slow
Check whether your current connection is transferring slowly, responding late or struggling with name lookups. Choose a targeted tool and keep its summary to compare results or explain a problem.
Where you will workTools and Activity Log
AllowA few seconds to a minute, or until you stop a continuous check
Watch the key steps
A 46-second narrated overview. Follow the full instructions below when you try it.
Read the video transcript
Choose the right check. Open Tools on the connection you want to investigate. Use Speedtest for an active performance check only when you can allow substantial traffic.
Compare delay and DNS. Use Latency to inspect response timing and DNS lookup to examine name resolution. Keep the destination and connection consistent when repeating checks.
Inspect details and route. Connection details identifies the interface and configuration. Route trace follows responding hops. An unanswered hop can simply mean a router ignores probes.
Review the saved evidence. Review each produced summary in Activity Log. Tools work over Ethernet too. These are momentary checks; compare them alongside recorded Wi-Fi history before choosing a network.
Open the app view at full size to inspect its controls.
Before you start
Give your result a useful basis
- Connect your Windows laptop to the network you want to check and pause other large transfers.
- For Speedtest, allow for substantial traffic, often several hundred MB or more. A metered or limited connection may not be suitable.
- Keep the same Wi-Fi connection for the whole run if you want the Activity Log entry linked to that network.
Open Tools
Start with the symptom you want to understand. Connect to the network, open Tools and choose Speedtest, Latency, DNS lookup, Connection details or Route trace. You control when a check starts, and only one tool runs at a time.
Measure HTTP speed
Check active transfer performance with Speedtest. Half-duplex measures receiving and sending in sequence; full-duplex measures both at once. Follow the live Mbps charts, HTTP ping and jitter. HTTP ping includes the HTTPS server response and differs from ICMP ping. Allow for substantial traffic, often several hundred MB or more.
Watch latency and packet loss
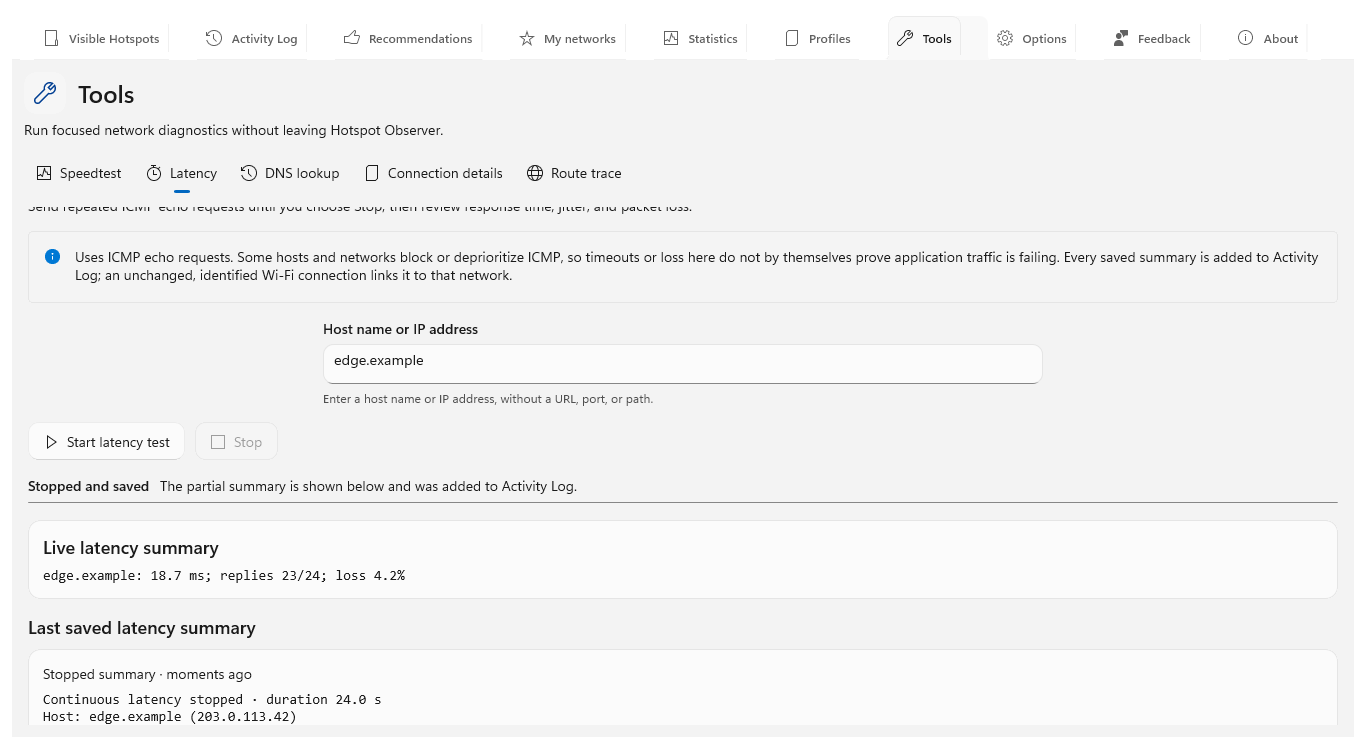
For delayed or interrupted responses, enter a host name or IP address in Latency and start the continuous check. It sends ICMP echo requests until Stop, summarizing replies, timeouts, response time, jitter and packet loss. Blocked or deprioritized probes can affect results independently of your applications.
Investigate DNS
If names fail to open, choose DNS lookup and an Investigation, enter a DNS name or IP address without a URL, port or path, then select Look up host. Windows address lookup uses normal IPv4/IPv6 resolution and caching. Advanced checks retain the answering resolver, response code, TTLs and answer, authority and additional records with exact timing bars.
Query records and reverse names
Find the particular DNS evidence you need with DNS record query, a record type or Custom TYPE number. SRV and TLSA need the full service name. Reverse DNS queries PTR names for an IP or up to 16 addresses resolved from a name; a PTR record alone cannot establish ownership.
Compare resolvers and response times
See whether resolvers differ by supplying up to eight comma-separated IPv4/IPv6 addresses without ports. Most checks use the first supplied resolver or configured DNS when blank. Compare resolvers checks configured DNS plus each supplied address; when blank it also uses DNS resolver addresses 1.1.1.1, 8.8.8.8 and 9.9.9.9. Repeated measurements sends 2–20 requests and compares answers ignoring TTL changes. The app cache is bypassed, but upstream caches remain. TCP only tests TCP; otherwise truncated UDP replies fall back to TCP.
Trace delegation and inspect DNSSEC
Investigate where DNS delegation stops with Trace delegation, which follows nonrecursive referrals from root servers toward an authoritative server with a 16-hop limit and explicit incomplete results. DNSSEC evidence requests signed records and reports AD, the resolver’s authentication claim, without independently validating signatures. Use the zone apex for zone-key checks; missing host-name keys do not prove an unsigned parent zone.
Inspect email DNS
For mail-name problems, enter the exact mail domain to inspect MX, SPF, DMARC, MTA-STS and TLS reporting. Supply the sender’s DKIM selector for its key. These are DNS checks, not delivery, policy inheritance, SPF evaluation, DKIM signature or HTTPS policy tests. Stop keeps completed advanced-query evidence in Activity Log.
Read connection details
Check which connection your computer is using in Connection details. Review the preferred connection, interface type, local addresses, gateways, DNS servers and available reported link speed. Link speed describes the connection’s configuration, not measured internet throughput.
Read the technical snapshot
Keep configuration clues when reporting a problem: Connection details includes available security, adapter ID and MAC, IP prefixes and origins, MTUs, DHCP and DNS settings, IP support and cumulative counters. Wi-Fi details can include BSSID, channel, PHY, RSSI with bars, quality, negotiated rates and 802.1X state. My networks retains the latest timestamped connection and session snapshots; unavailable fields remain unknown.
Trace the route
Explore the path to a destination with Route trace. Enter the destination and follow measured hops; Stop keeps a partial summary after the first measured hop. An unanswered router may simply decline ICMP probes and does not by itself identify a broken connection.
Review the saved summary
Return to a result without rerunning its test: each tool keeps its previous summary when you switch tools. Every produced result also goes into Activity Log, linked to the Wi-Fi network when the same identified network stayed connected. Stopping continuous latency or route trace after a measurement preserves the partial summary.
Compare like with like
Compare results from the same place, connection and similar times to reduce misleading differences. Use these momentary checks alongside Recommendations and Statistics for evidence of observed Wi-Fi stability over time.
Check what you gained
You can now check that
- The selected tool shows a readable summary and keeps the previous saved summary if a new run cannot finish.
- Every produced summary appears in Activity Log, even without an identified Wi-Fi connection; an unchanged connection links the entry to that network.
- Stopping continuous latency or route trace after a measurement keeps and logs the partial summary.
Updated by Hotspot Observer · 21 October 2026