Guide 12
Check whether a network stays visible through your day
Look beyond the current nearby list to see repeated presence, gaps and time patterns. Compare the same period for each candidate and judge whether the recorded monitoring covers the hours you care about.
Where you will workStatistics
Allow10–15 minutes
Watch the key steps
A 48-second narrated overview. Follow the full instructions below when you try it.
Read the video transcript
Keep one context. Open Statistics. Choose one radio and date range for every comparison. Check Overview coverage: unknown monitoring time is not evidence of absence.
Inspect presence and gaps. Open Presence to compare timelines, disappearances and complete interval durations. Interrupted or date-clipped intervals are excluded from complete-duration summaries.
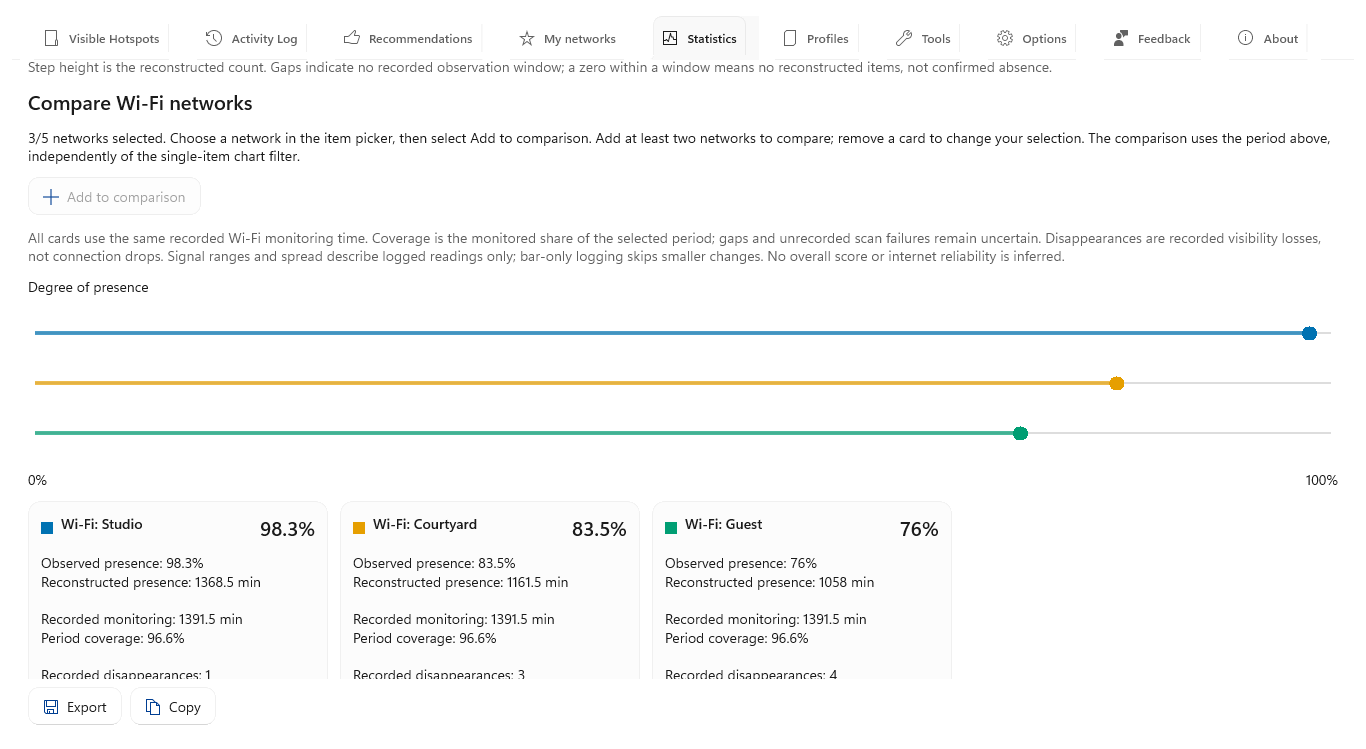
Compare candidates and patterns. Add up to five Wi-Fi networks to comparison. Use Time patterns to inspect weekday and hourly averages, checking recorded minutes behind each slot.
Check supporting details. Inspect Signal and Details for retained readings and events. Export the prepared view when you need a record. Presence describes nearby visibility, not connection uptime or future stability.
Open the app view at full size to inspect its controls.
Before you start
Give your result a useful basis
- Select one radio type and one date range, then keep both unchanged while comparing items.
- Use a period with enough recorded monitoring; blank or interrupted monitoring is unknown evidence.
- For Wi-Fi comparison cards, choose no more than five networks with observations in the selected period.
Set one comparison context
Choose a period that matches your question in Statistics, or open it from an item’s Statistics action to select that item immediately. Choose Wi-Fi or Bluetooth and recent or custom local dates. Leave the item unselected for an overview. Refreshing... covers only chart regions being prepared, leaving filters, navigation and independent comparison cards usable.
Use Overview first
Check how much of your chosen period was actually monitored in Overview. The coverage ring separates recorded time in blue from unknown time in gray with exact percentages. Average and peak counts, median complete duration and disappearances summarize observations; count-chart shading stops between monitoring windows.
Read Presence
Find breaks in visibility in Presence. Compare the timeline, presence percentage, longest observed intervals and disappearances per monitoring hour. Duration columns share a scale; the median and 90th percentile exclude interrupted or date-clipped intervals. Use these as history rather than a forecast.
Compare Wi-Fi candidates
Make differences easier to judge by adding up to five Wi-Fi networks to comparison. Match the colored dots and cards on the shared 0–100% presence chart, then read coverage, disappearances, longest interval and signal range with bars. Unknown evidence remains labeled explicitly.
Open Time patterns
Check whether a pattern fits your routine in Time patterns. The 168 weekday/hour slots use local time: darker green means more average visible items during monitoring and gray dashes mean none was recorded. Hover or expand Exact weekday and hour values for averages and minutes; hourly and weekday bars give broader summaries.
Check Signal and Details
Follow a suspected change into Signal or Details. Signal dots are retained readings, while Details provides service lists and recorded events. Select an item to compare its observed before-and-after values without assuming continuous measurement between points.
Check what you gained
You can now check that
- Every item is compared over the same period and monitoring context.
- You can separate observed presence from monitoring coverage and identify incomplete or clipped intervals.
- You know which patterns are supported by repeated evidence and which remain uncertain.
Updated by Hotspot Observer · 21 October 2026