Guide 05
See which nearby Wi-Fi networks share channels
Understand the radio layout around your workspace and keep a before-and-after comparison when settings change. Match networks to channel curves without treating overlap as proof of interference.
Where you will workVisible Hotspots, the channel diagram, and Technical details and services
Allow5 minutes
Watch the key steps
A 40-second narrated overview. Follow the full instructions below when you try it.
Read the video transcript
Start from the nearby list. Open Visible Hotspots and choose Wi-Fi. Clear search and minimum-signal filters for an initial overview from the same location.
Match the network and curve. Select a network to highlight its curve and band. Use the colored legend to select and reveal the matching list row.
Check radio details. Expand Technical details and services to read the reported frequency, band and center channel. Missing fields remain unknown.
Save a comparison. Export the selected band's diagram and filtered rows. Curve widths are illustrative; overlapping curves do not establish interference. Use recorded history to assess stability.
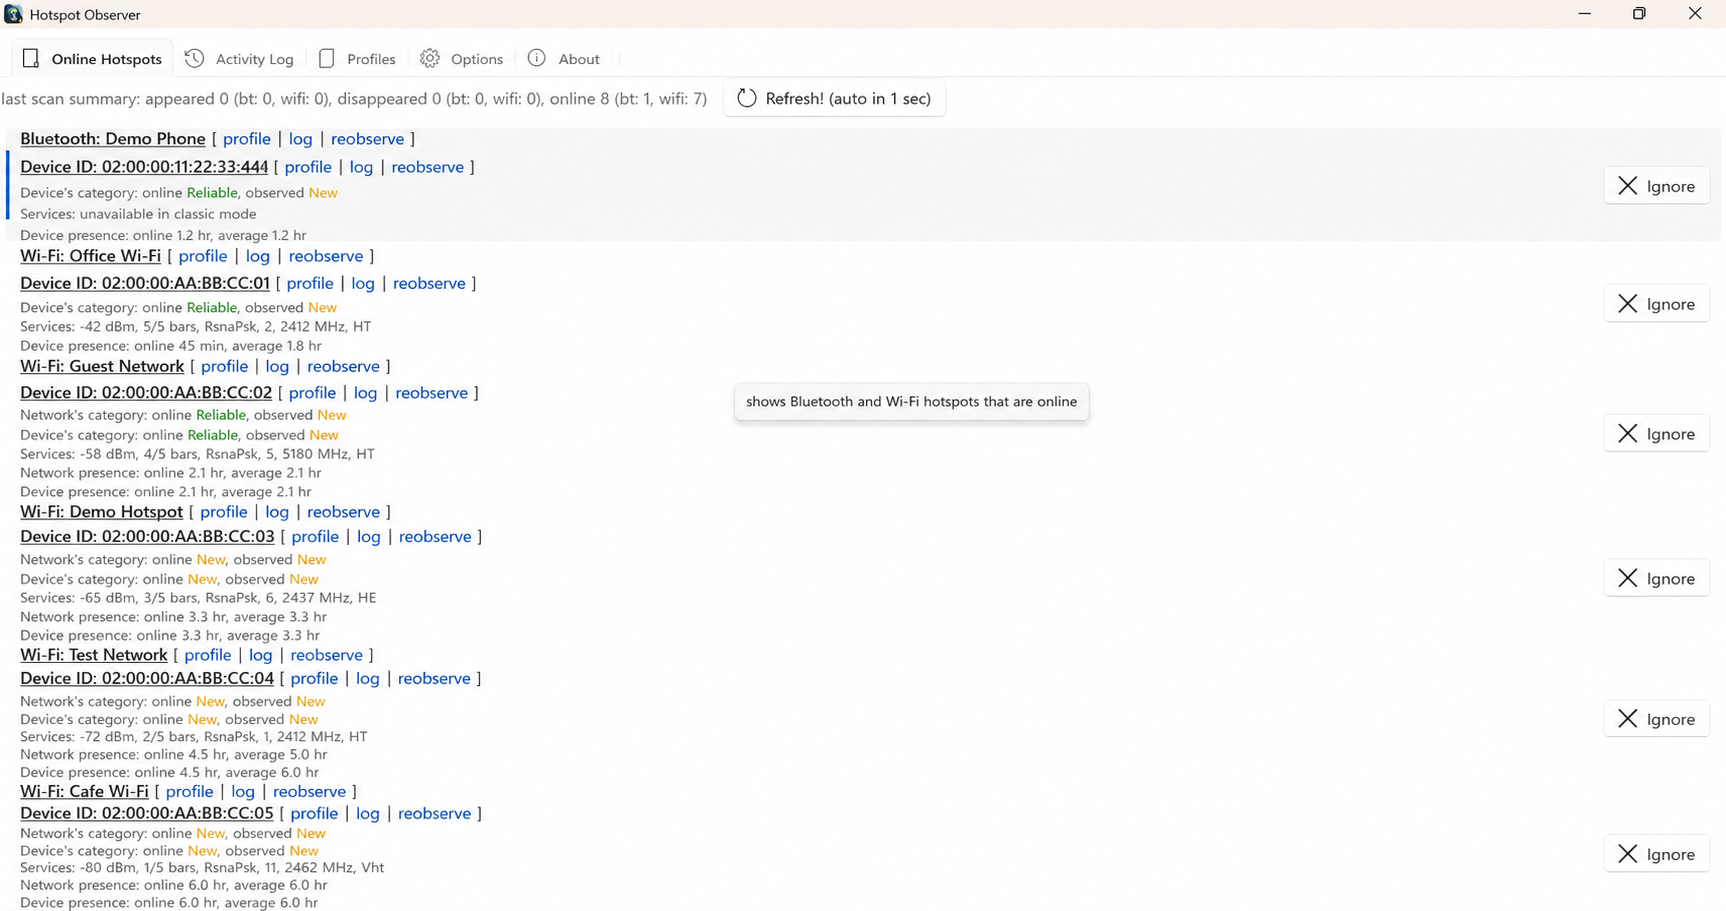
Open the app view at full size to inspect its controls.
Before you start
Give your result a useful basis
- Enable Wi-Fi observation in Options and wait for a successful scan.
- Compare from the same location; moving your laptop changes which access points it can observe.
Show the networks you need
Get an overview of your surroundings in Visible Hotspots → Wi-Fi. Clear search and minimum-signal filters first; use them later to narrow both the list and diagram to the networks you want to compare.
Select a network and band
Find your network in the diagram by selecting its list row. Its curve highlights and the diagram switches to its band. Choose other bands to explore them; networks with unknown channel or signal are counted separately rather than plotted at guessed positions.
Match curves to list rows
Follow a curve back to its details using the colored network names below the diagram. Select a legend button to reveal the matching row. Hover for full names when labels are crowded; legend ordering follows your list’s rating or signal order.
Check the reported radio details
Check the reported facts before changing router settings. Expand Technical details and services for frequency, derived band and center channel, PHY, authentication and encryption where available. Missing fields remain unknown, and center channel alone does not establish channel width.
Keep a comparison
Export the prepared view to keep the selected band’s diagram, legend and filtered rows in a workbook. Repeat from the same location after a router change. Use Statistics and My networks to assess observed stability and connection sessions alongside the channel picture.
Check what you gained
You can now check that
- You can match the selected network's list row, highlighted curve and legend entry in the selected band.
- Your saved report includes the selected band's channel diagram and the filters used for the comparison.
Updated by Hotspot Observer · 21 October 2026