Guide 14
Keep evidence you can review or share later
Save the comparison you prepared as a readable report with charts and supporting values. Revisit a Wi-Fi decision later or share the relevant evidence without rebuilding your filters.
Where you will workExport and Copy
Allow5 minutes
Watch the key steps
A 49-second narrated overview. Follow the full instructions below when you try it.
Read the video transcript
Prepare the source view. Set filters and sorting before exporting. In Statistics, choose the radio, period, item and tab. Export and Copy use the current view.
Save a workbook. Choose Export and save the workbook. It preserves the prepared view with editable objects and supporting numeric evidence. Activity Log also offers CSV and text.
Inspect supporting sheets. Check Item statistics and chart data for exact values. Unavailable metrics remain blank rather than zero. Editing presentation shapes does not recalculate statistics.
Check and share the result. Choose Open to inspect the saved file, or Copy for a quick table. Confirm the filters and rows match your source. Review identifying details before sharing a report.
Open the app view at full size to inspect its controls.
Before you start
Give your result a useful basis
- Finish filtering and sorting the source view before exporting; only the current view is included.
- In Statistics, choose the radio, date range, item, and tab that should appear in the workbook.
- Choose a destination folder you can find again and close an older file with the same name if another app has it open.
Prepare the view
Choose the evidence you want to keep before saving: filter Visible Hotspots, Activity Log, its grouped side list or Profiles. In Statistics, choose the radio, period, item and tab. Export and Copy follow the current view.
Choose Export
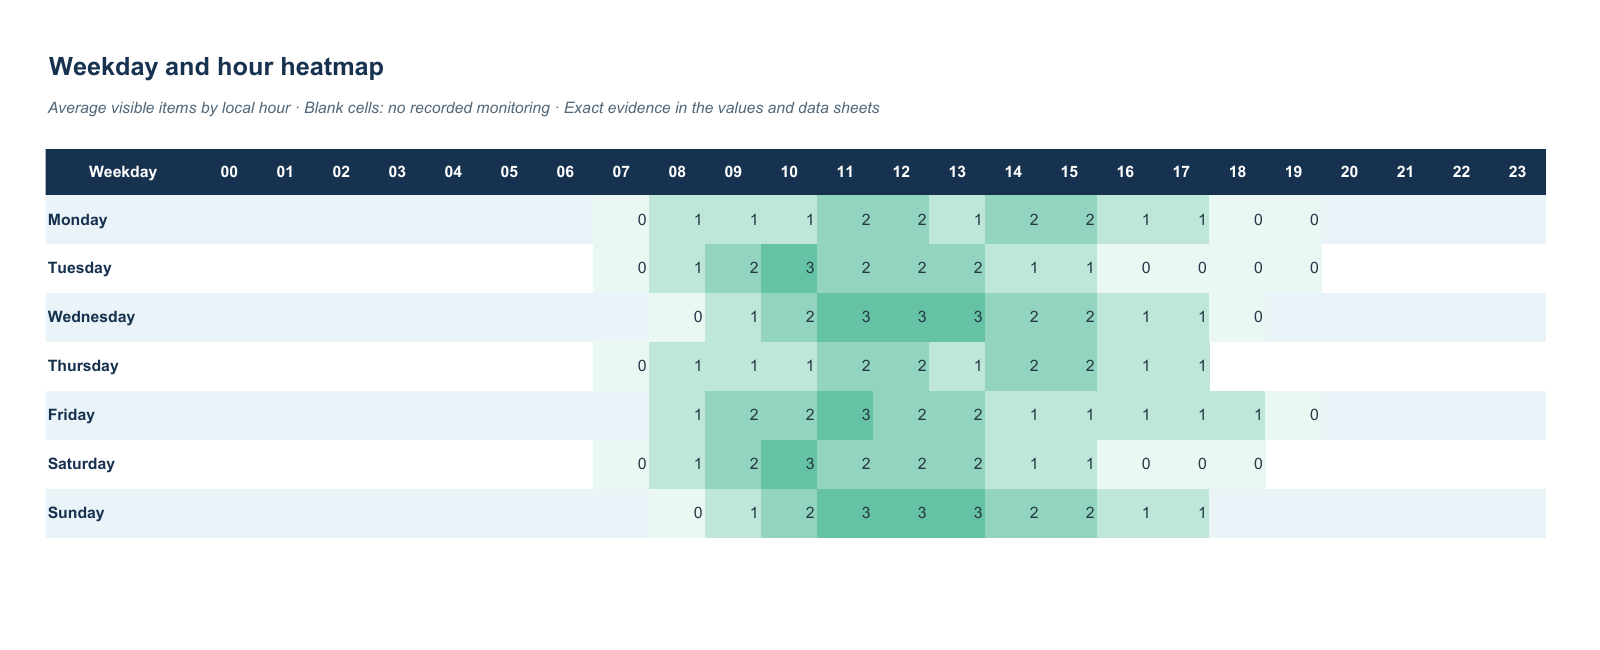
Choose Export to keep the view’s text, colors, cards and charts in a workbook. Visible Wi-Fi includes the selected band’s channel plot and legend. Current view uses editable text boxes and shapes; edits do not recalculate statistics. Statistics also has native Editable charts linked to Chart data. Supporting sheets keep all filtered rows and exact evidence, including the 168 heatmap slots; monitoring gaps remain separate. Activity Log also offers CSV and text.
Analyze Item statistics
For your own comparisons, sort or filter the Item statistics sheet by presence, coverage, disappearances per monitoring hour, longest intervals or median and 90th-percentile complete durations. It includes matching items beyond chart row limits. Percentages and fractional minutes stay numeric; blank metrics mean unavailable evidence.
Choose Copy for a quick table
Use Copy when you need a quick table for a spreadsheet, document or message. It places the displayed data on your clipboard and confirms the action without shifting the layout.
Return to the source
Choose Open after exporting to review the saved file and confirm its period, filters and rows. Remove identifiable names, addresses and notes before sharing. The report preserves observed evidence; it cannot establish speed or connection uptime from nearby visibility.
Check what you gained
You can now check that
- The saved file opens and its heading, filters, period, and rows match the source view.
- Excel opens with the prepared view's text, colors, cards and chart geometry as editable objects. Visible Wi-Fi reports include the selected band's channel plot and legend. Supporting sheets retain numeric metrics, readings and intervals.
- Copied tables paste into a spreadsheet or document with useful columns intact.
Updated by Hotspot Observer · 21 October 2026